Visualize your spending and group debts
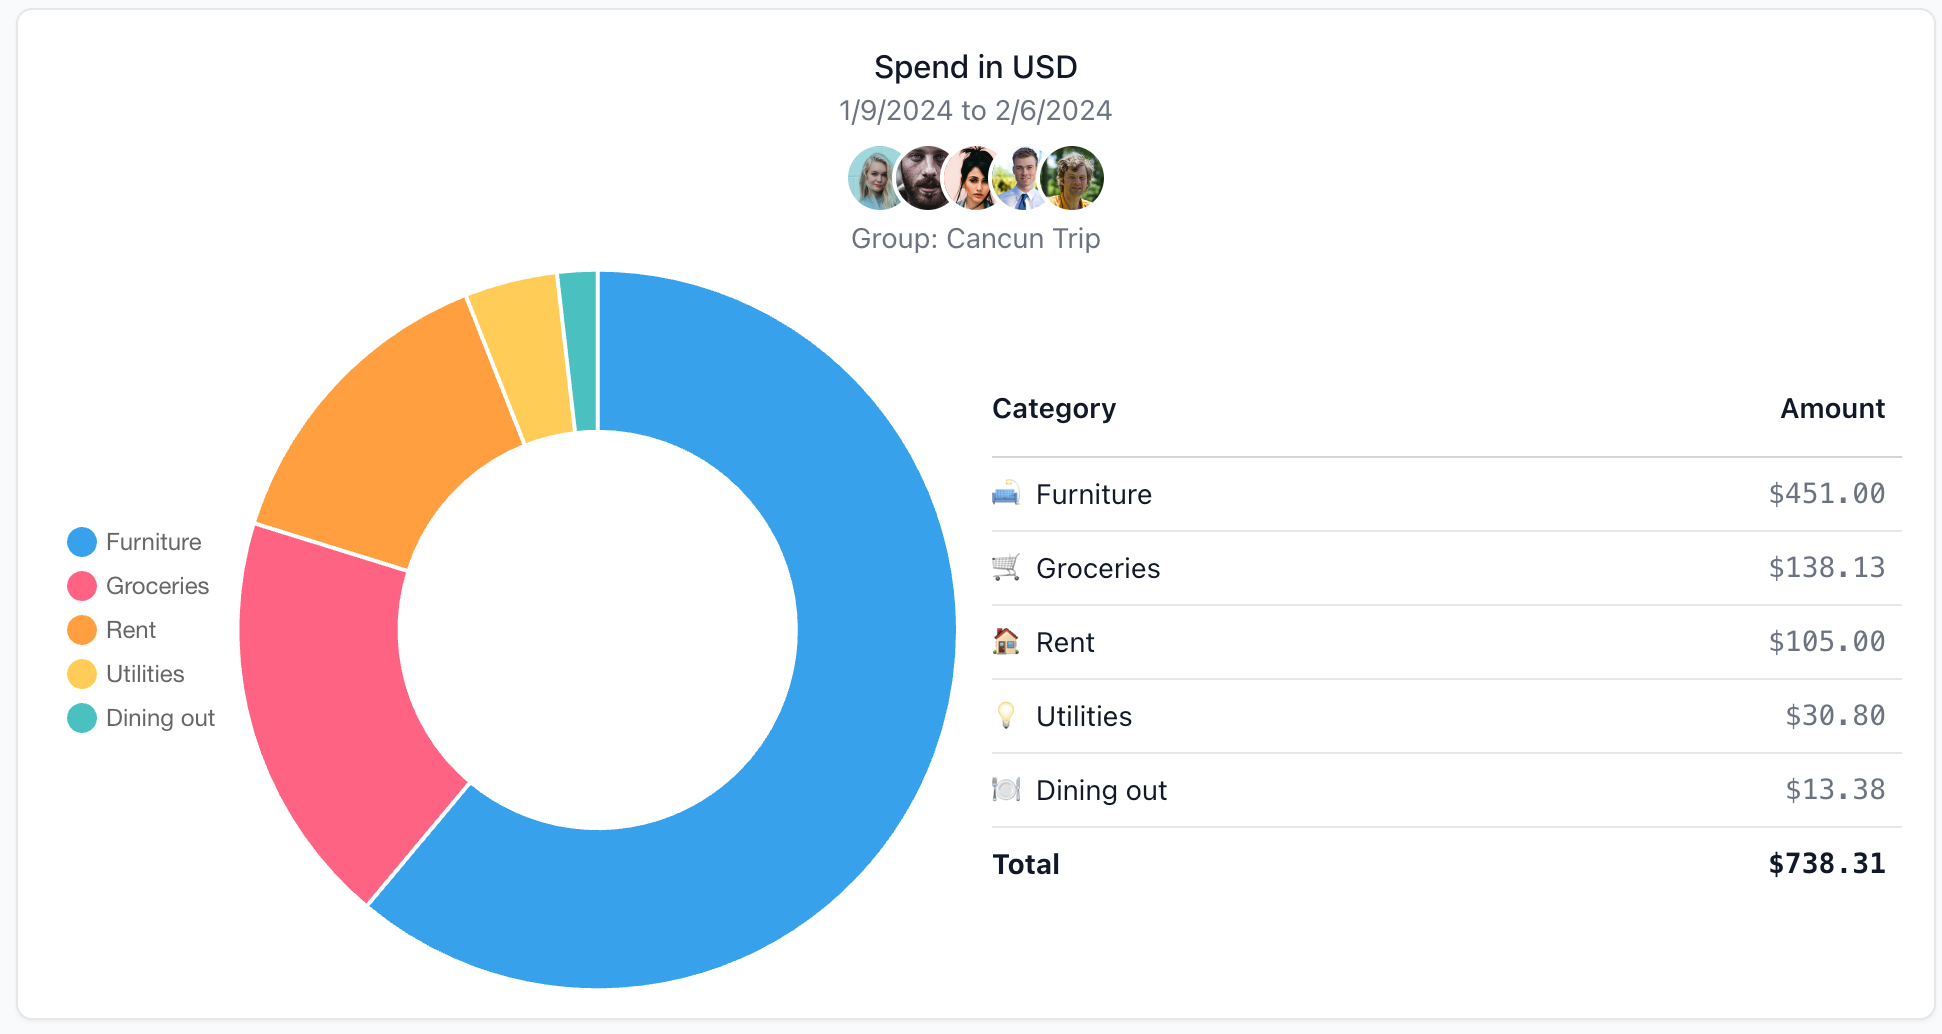
View expenses category breakdown
You can create a Group on SplitMyExpenses or create a friend then split expenses with them. Ensure you have tagged your expenses with a category, so you can see a breakdown of your spending. Once you have at least one expense split, you can view the category breakdown.
- Visit the Group or Friend page
- Click Stats tab

You will see a breakdown of your expenses by category. You can see the total amount spent in each category and the percentage of your total spending in the pie chart.
To get the most out of this feature, ensure you tag your expenses with a category. You can do this when you add an expense or edit an existing expense.
You can filter this chart by:
- Date range
- Currency
- Members (group only)

View group debts graph
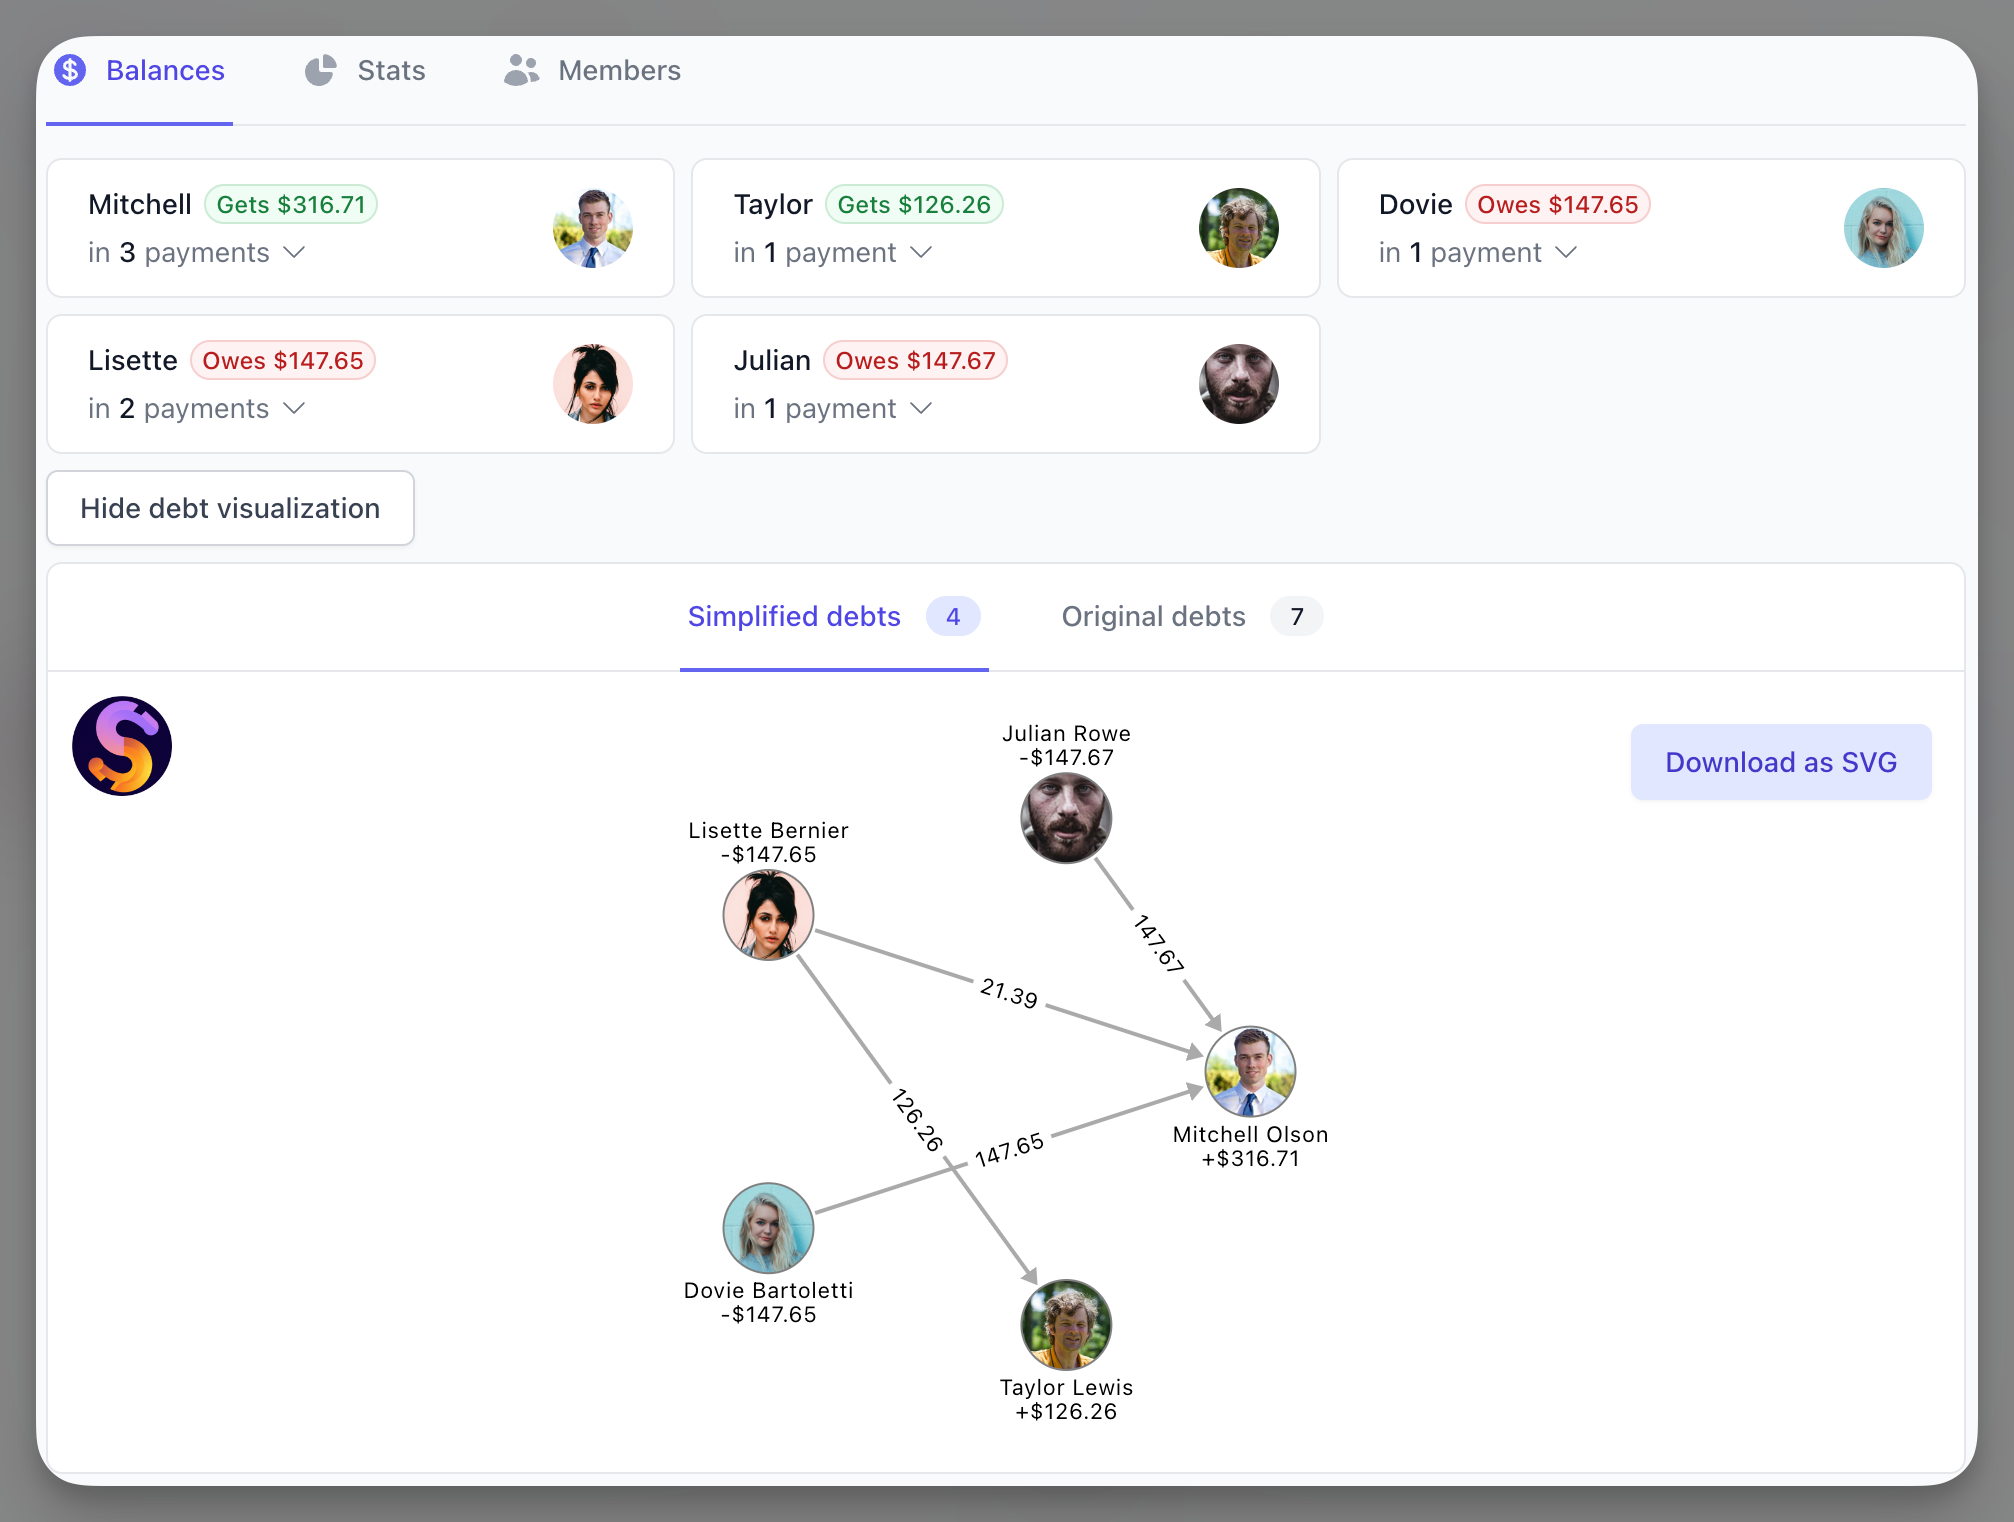
Once you create your group and add members to it, you can start adding expenses. Once you have at least one expense split, you can view the group debts graph.
The beautiful graph representation helps you understand the simplified debts vs original debts. By default, all SplitMyExpenses groups have simplified debts turned on, so you don't need to worry about making wasted payments.
- Visit the Group page
- Click Balances tab
- Select Show debts visualization

You will see a graph representation of who owes who. You can see the simplified debts and the original debts. You can see the total amount owed and the number of payments required to settle the debts.
You can even export the debts to an image to share with your group! Really useful for when you are trying to explain to someone why who owes who.
Conclusion
SplitMyExpenses helps you visualize your spending and group debts. You can see a breakdown of your expenses by category to get insights into your spending. You can visualize your group debts in original and simplified views, so you can understand who owes what.
If you have any questions, or you need some help, please reach out to us: support@splitmyexpenses.com.

Creator of SplitMyExpenses.com